For the Acid and Bases section of Chemistry we did an Acid-Base Titration Lab. So what is Titration? A titration is a process that is used to determine the volume of a solution needed to react with a certain amount of another substance. For this experiment we used a titrate hydrochloric acid solution, a basic sodium hydroxide solution which is also known as HCl and we also used NaOH. We were given the amount of concentration of the NaOH solution. The whole point of the lab is to determine the unknown concentration of the hydrochloric acid solution. In the experiment we used our laptop to monitor the pH levels as we titrated by using the application LoggerPro. The volume of the NaOH titrant we used at the equalivelance point is what we had to use to determine the molarity of the HCl. Before starting this lab make sure to put on a pair of goggles because you should always handle the hydrochloric acid with care. It can cause painful burns if it comes in contact with the skin. For the procedure we filled a pipet with 10 mL of the HCl solution into a 250-mL beaker. Then we added 50 mL of distilled water. Then we placed a sensor into the beaker full of liquid. And since my lab partners and I didn't have a magnetic stirrer and stirring bar we stirred the beaker by hand. Then we were able to begin the Titration when the pH stabilized. One person manipulated and read the buret while another person was operating the LoggerPro and changed the volume. Every time we changed the volume we had to save the data and then pair it for the next step of the experiment. For every new increment we had to add more of the NaOH solution which basically means we were changing the base solution that we started with at the start of the experiment and then change it to a very acidic solution by the end of the experiment. 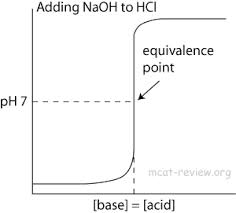 The graph to the left is the exact replica of the shape of the line that I guessed would happen with the Titration Lab. I guessed that the line would start at the very bottom because it is an acid and then it would start off slowly and then would increase and the line would begin to curve straight up because you are changing the acid to a base so quickly. And then once it was almost completely all a base the line will continue on without any change.  The graph to the left is our exact experiment data that we recorded during this lab on LoggerPro. And as you can tell it was very very similar to my hypothesis guess.
0 Comments
Leave a Reply. | AuthorMy name is Erica Harris and I am a Junior at La Junta High School. This is my blog for my Chemistry class. ArchivesMarch 2014 Categories |
| Erica's Chemistry Blog |
|
 RSS Feed